Report Up! Create A Quarterly Partnerships Report With Claude
Expert advice from Pallavi Singh (Quo, Interim Head of Partnerships).
Snapshot
You can build a strong partnerships program and still lose the room when it is time to report on it. If your updates are packed with partner counts, referral rates, and launch activity, but leadership thinks in revenue, risk, and resource decisions, your work can be misunderstood even when performance is real.
Pallavi shows a practical way to close that gap. Instead of spending hours stitching together notes, exports, and scattered updates, you can use AI to turn raw partner data into a clean quarterly narrative that leadership can actually act on. The big opportunity is not just speed. It is clarity. It is getting your partnerships story understood, funded, and backed by the people who control headcount and budget.
If you want to solve unclear reporting, manual data wrangling, and weak executive alignment, keep reading to see how Justin Zimmerman and Pallavi Singh can help you do it.
Partnerships often has the results. The challenge is translating them into the language leadership uses to make decisions. -Pallavi Singh
Table of Contents
- Snapshot
- Why partnership reporting breaks down
- What a good report needs to do
- The context behind the report
- The core workflow inside Claude
- How to write better instructions
- How to build the recurring prompt
- What the generated report should include
- Why the talk track matters
- Where human judgment still matters
- Data hygiene and source of truth
- Recommended tools
- FAQs
- Conclusion
Why partnership reporting breaks down
If you work in partnerships, you already know the strange tension in executive reporting. Your work is real. Your outcomes matter. But your language often does not match the language of the rest of the leadership team.
Sales usually reports on pipeline and revenue. Marketing shows lead volume, conversion, and campaign performance. Finance cares about efficiency, payback, and planning. Partnerships, meanwhile, tends to report on referral activity, partner activation, co-marketing, launches, and ecosystem momentum.
None of those metrics are bad. In fact, many are essential. The problem is that they do not naturally translate into executive decisions unless you frame them correctly.
That disconnect creates a familiar pattern:
- You spend hours compiling updates.
- You present a lot of detail.
- Someone asks for the partner sourced revenue number.
- The room moves on before the deeper story lands.
What gets lost is the actual strategic value of partnerships. Not because it is missing, but because it is not packaged in a way that leadership can absorb quickly.
This is exactly where AI can help. Not by replacing judgment, but by compressing messy inputs into a clearer business narrative.
What a good report needs to do
Pallavi is not trying to create a prettier status update. She is solving for a more important outcome: a report that helps leadership understand what is happening, what matters, and what decisions need to be made.
That means your quarterly state of partnerships report should do a few specific things well:
- Lead with revenue. Start where the company starts.
- Explain the why behind the numbers. Not just movement, but meaning.
- Surface risks early. Show what needs attention before it becomes a surprise.
- Frame asks as decisions. Make it easy for leaders to act.
- Create a paper trail. Document what happened, what was expected, and what comes next.
That last point is bigger than it looks. If you create a report every quarter, you stop relying on memory and one-off slides. You start building an operating record. That record becomes incredibly useful for planning, hiring cases, budget requests, and pattern recognition.
If you are thinking through broader AI operating models for partner teams, this pairs well with this practical playbook on how AI will reshape partnerships, especially around starting with repeatable use cases before expanding.
The context behind the report
The reporting approach makes more sense when you understand the operating environment Pallavi is working in.
At Quo, the partnerships function is still relatively young, around two years in. The team itself is lean, just three people, yet it manages four partner channels:
- Agency
- Ecosystem
- Technology and integrations
- Franchise, which is being added
Across those channels, the program supports roughly 900 partners. In a short period, the team went from zero partners to hundreds, launched a dozen integrations in the previous year, and drove a meaningful share of new company revenue.
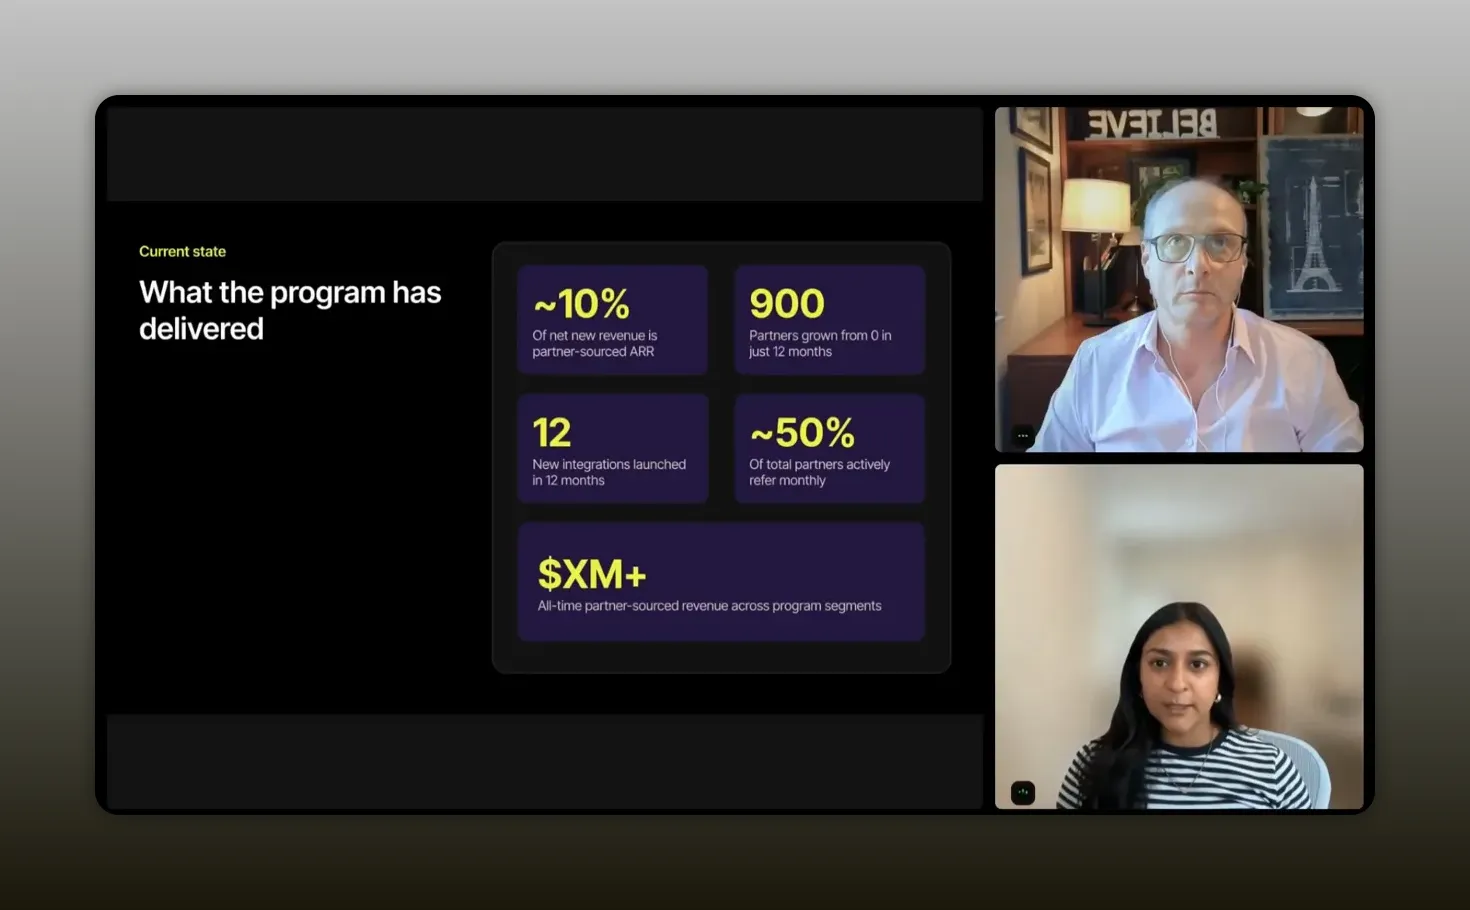
Once partnerships starts driving real revenue, deeper reporting stops being optional. -Pallavi Singh
That matters because reporting needs change as a partner program matures.
In the earliest phase, your main job is to prove the function deserves to exist. You are validating the model. You are establishing that partnerships can create reach, influence, and revenue.
But once the function moves past that first proof stage, expectations rise. The company is no longer asking whether partnerships can work. It is asking how fast it is growing, where it is underperforming, what risks are emerging, and what investment is justified next.
That is where manual reporting starts to break.
The core workflow inside Claude
The actual build is refreshingly practical.
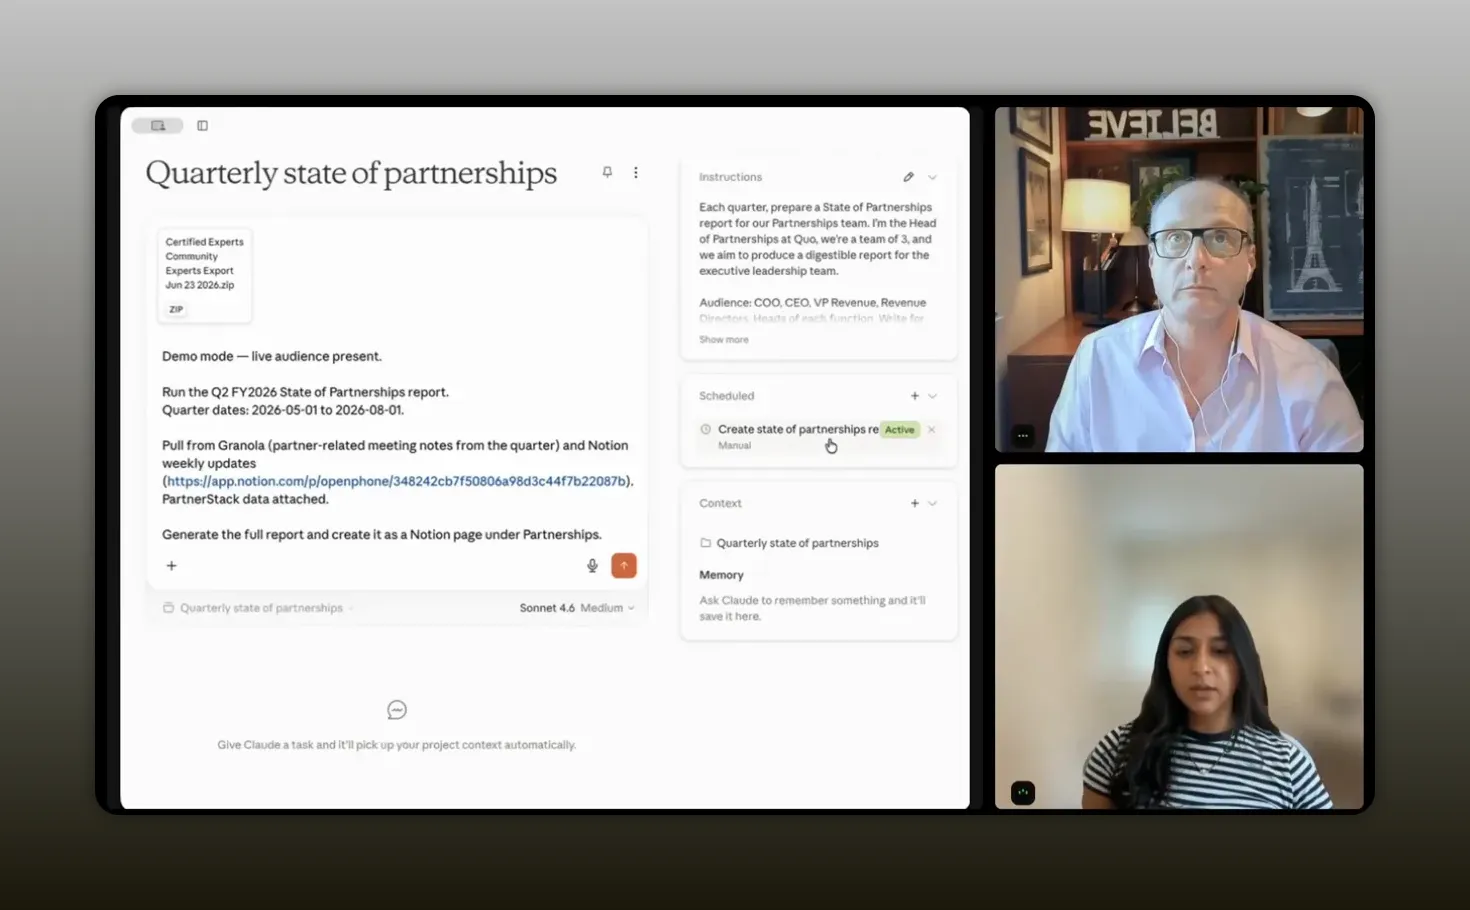
Pallavi sets up a dedicated project inside Claude for one recurring purpose: generating a quarterly state of partnerships report. You can use Claude or another AI assistant, but the key is not the brand. The key is the repeatable system.
The workflow looks like this:
- Create a dedicated project for the report.
- Write strong reusable instructions.
- Define the audience, tone, and guardrails.
- Attach the relevant data sources.
- Run a recurring prompt each quarter.
- Review, edit, and verify before sharing.
That may sound obvious, but the order matters. Most people start by trying to write one perfect prompt. Pallavi takes a smarter route. She starts with context, expectations, and constraints. Then she turns that into reusable project instructions.
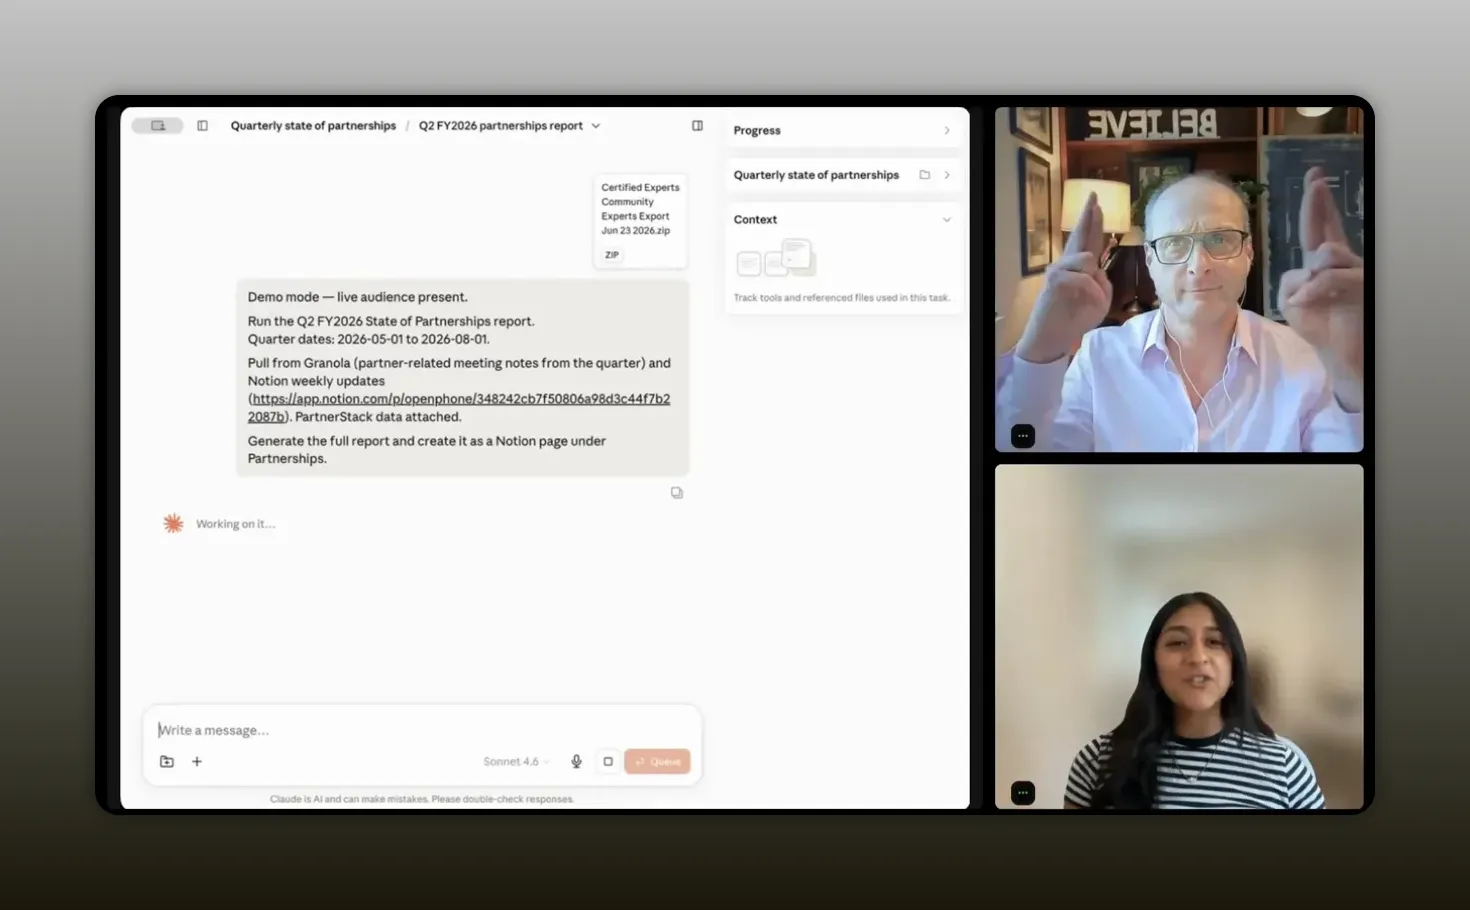
The instructions are the heart of the report. -Pallavi Singh
One especially useful detail is how those instructions were drafted. Instead of trying to type a polished brief from scratch, Pallavi used speech to text. She talked through what the team looks like, who the report is for, how leadership behaves in meetings, what questions usually come up, and what kind of output would actually help.
That is a great reminder that AI setup does not have to begin with perfect writing. It can begin with clear thinking spoken out loud.
How to write better instructions
If you want better outputs, you need better instructions. Pallavi’s approach is worth borrowing because it is grounded in real meeting dynamics, not generic prompt advice.
Her instructions cover a few critical areas.
Define the audience clearly
She explains who the report is for: an executive team that is smart, short on time, and sometimes skeptical. That changes everything. A report for a partnerships team can include more detail and channel nuance. A report for executives needs compression, clarity, and business framing.
Tell the model what not to do
She explicitly blocks filler language and shallow optimism. No vague cheerleading. No empty commentary about having a great month. No padded summaries of activity without implications.
That is important because many AI outputs sound polished while saying very little. You want the opposite. Fewer words, stronger meaning.
Ask for a point of view
This is one of the strongest parts of the setup. Rather than producing a neutral dump of metrics, the report should identify the single story that ties the quarter together.
That could be:
- Strong revenue pacing driven by one channel
- Healthy activation but weak conversion
- Integration launches improving retention
- A growing dependence on a narrow set of partners
The model should not just list updates. It should connect them.
Prioritize the so what
Activity alone is rarely persuasive. Partnership leaders often know this intuitively, but still end up presenting too much operational detail. Pallavi instructs the system to cut anything that does not have a business implication.
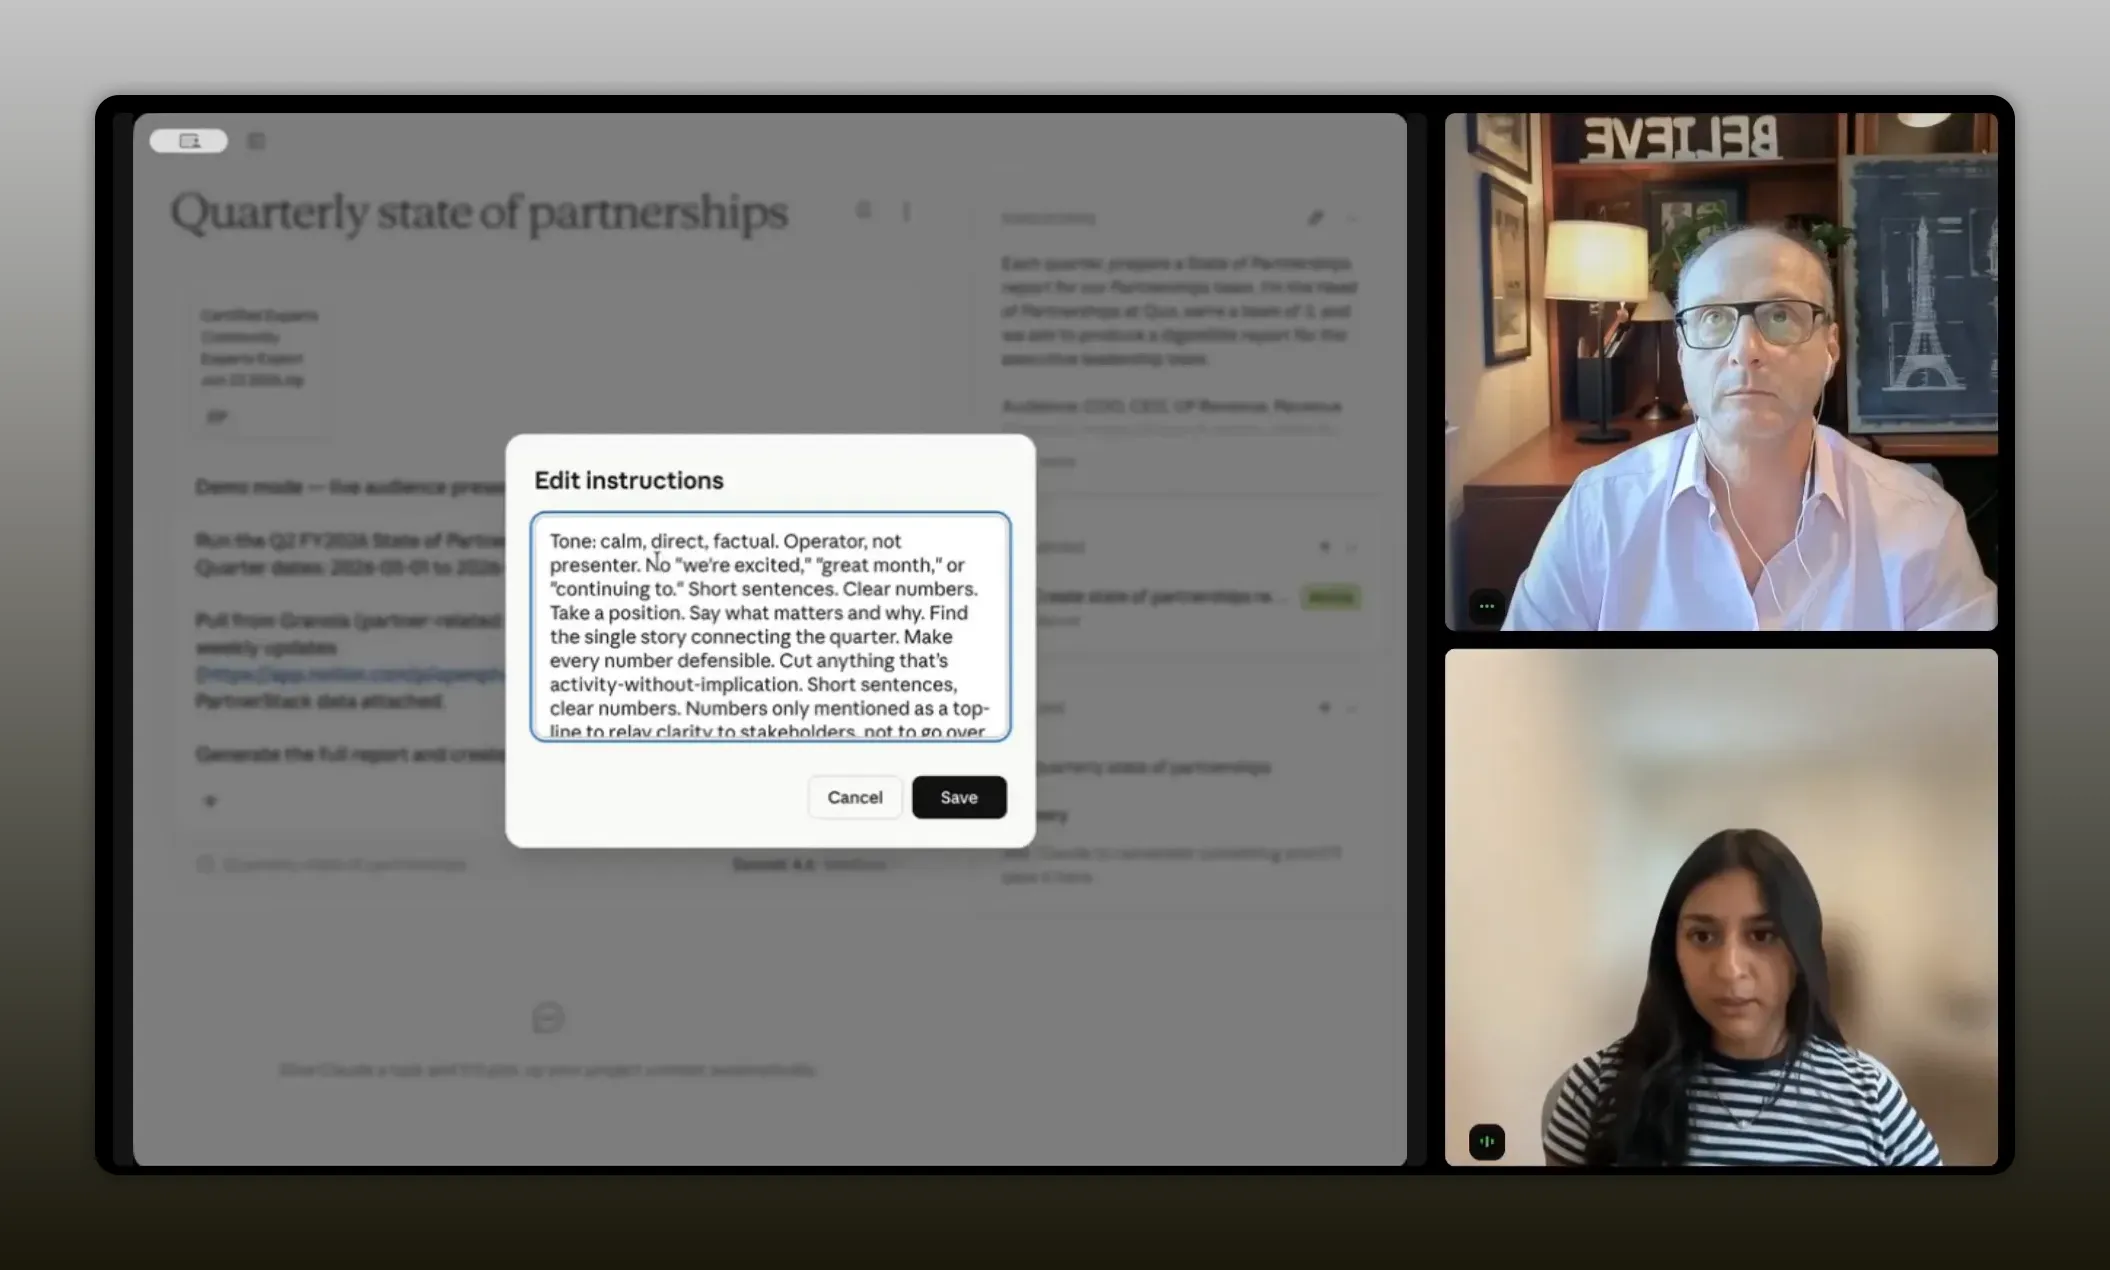
Cut anything that is activity without implication. -Pallavi Singh
Set guardrails
Good reporting AI needs boundaries. Pallavi includes instructions like:
- Do not invent numbers.
- Protect sensitive information.
- Avoid competitor details.
- Flag uncertain figures for verification.
This matters because executive reporting is one of the worst places to tolerate hallucinations. If an AI tool is uncertain, you want it to say so.
If your team is expanding AI into more structured workflows, you may also find value in this breakdown of AI, MCP, and operator workflows that scale, especially around building systems that create reusable artifacts.
How to build the recurring prompt
Once the project instructions are in place, the next step is creating a repeatable prompt you can use every quarter.
Pallavi has Claude generate that prompt for her, which is a smart move. It means the project not only stores the rules, but also produces a standard launch command for future runs.
The recurring prompt includes things like:
- The specific quarter being analyzed
- Whether the quarter is complete or still in progress
- What notes or exported files are attached
- Which data source should be trusted most
- Any context around fiscal timing or data limitations
That last point is important. In the example, some data comes from exported partner data rather than a direct MCP connection because the cleaner source is still the manual export. That is a very normal stage of AI adoption. You do not need perfect automation to get serious value.
You do not need perfect automation to get a report that leadership can actually use. -Justin Zimmerman
That makes this workflow especially accessible. If you can export CSVs, gather meeting notes, and upload documents, you can do this now.
What the generated report should include
When the run is complete, the output is not just a blob of text. It is a structured report designed for executive consumption.
The elements Pallavi highlights are worth making standard in your own version.
Executive summary
This is the front door. Leadership should be able to understand the quarter quickly from the top of the document. The summary should explain where the program stands, whether it is pacing above or below goals, and what the main story of the quarter is.
Performance against goals
The report should map results to expectations. If a quarterly target was set significantly higher than the previous quarter, the report should note that context. Hitting a harder goal tells a different story than hitting a flat one.
What is working
This section identifies the motions that are producing measurable business results. That may include one channel outperforming, a recent integration improving customer retention, or stronger activation within a partner segment.
What is not working
This section is just as important. Leaders do not need a flawless narrative. They need an honest one. The goal is to identify issues before someone else has to diagnose them for you.
What needs attention
Pallavi calls this one of the most valuable parts of the report, and that feels right. Sometimes you know the numbers are off, but not the cause. This section should help isolate likely causes and frame them in operational terms leadership can support.
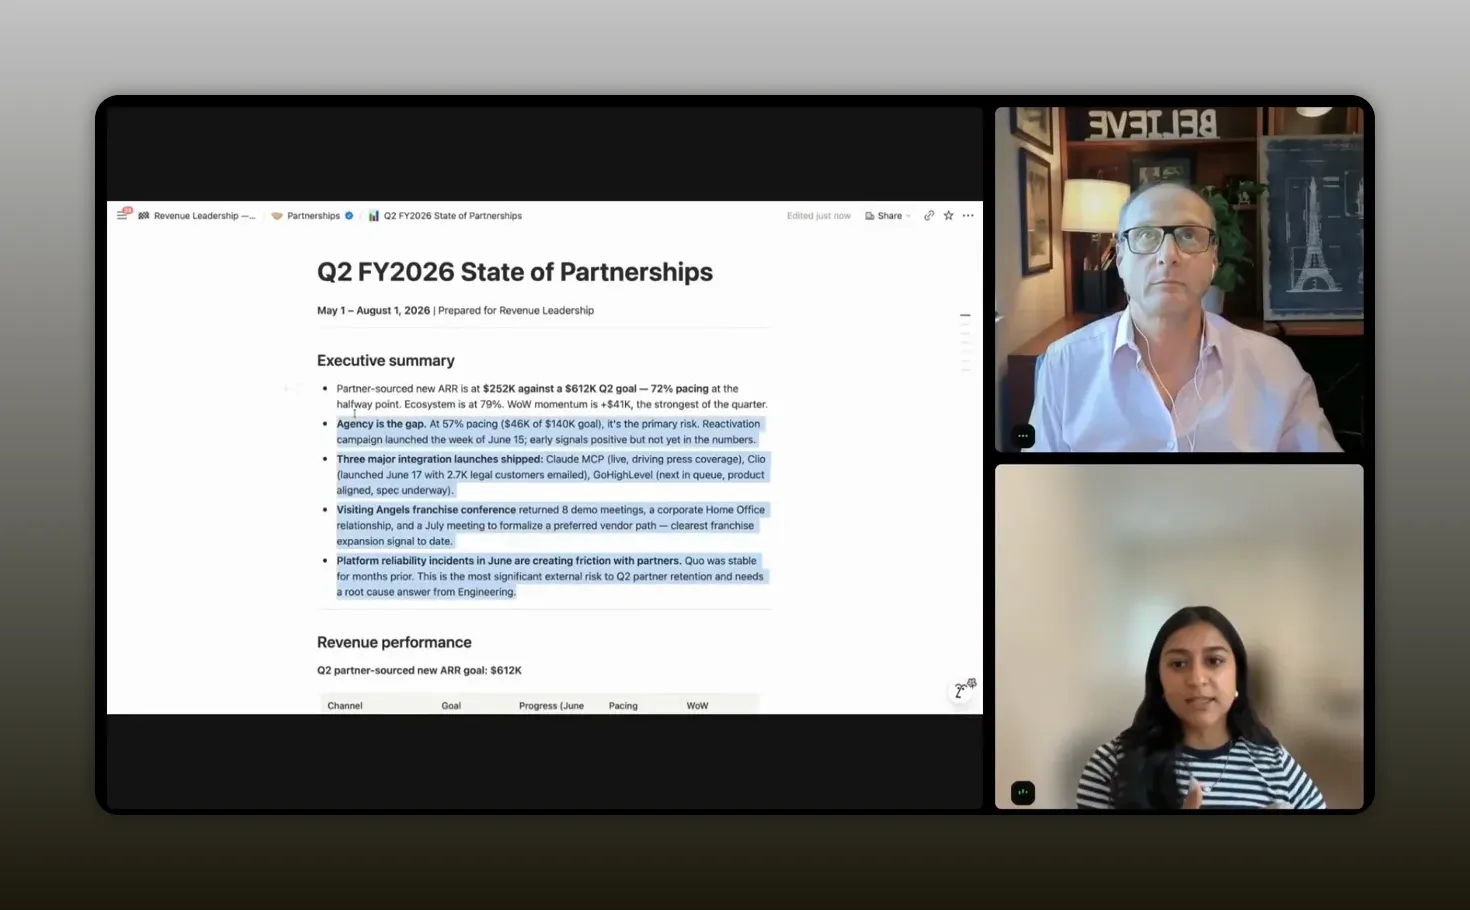
The what needs attention section is where you prove you can see the issue before it becomes a bigger one. -Pallavi Singh
Go to market asks
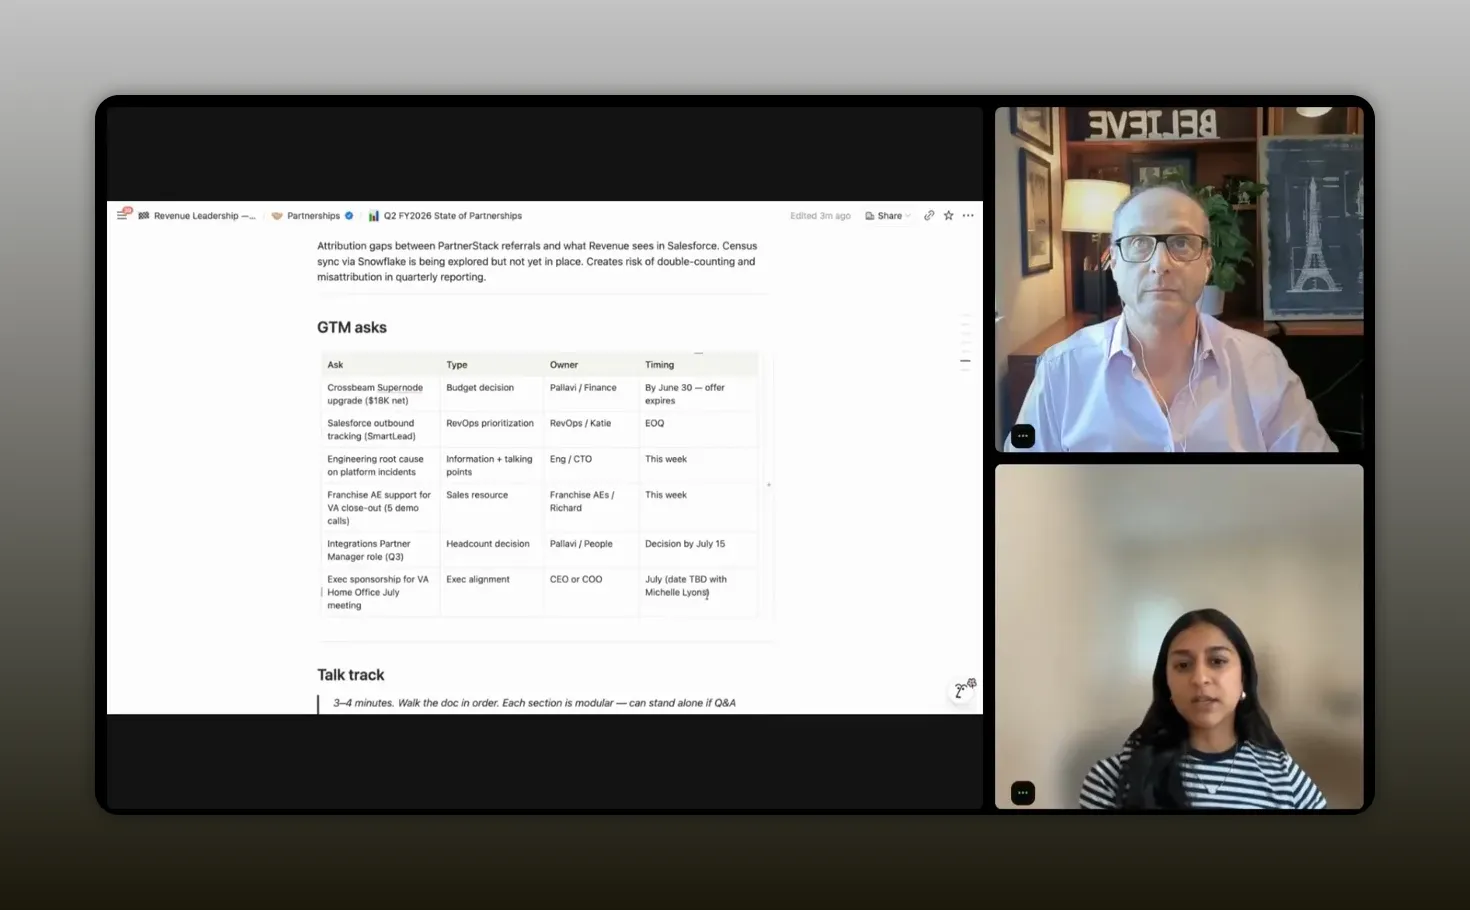
Every report does not need a giant list of requests. In fact, fewer is usually better. Pallavi notes that if the generated list is too long, she goes back and tightens it, ideally to one or two priority decisions.
That is a great discipline. Executive asks should be prioritized, not brainstormed in public.
Verification flags
If the AI is uncertain about a number, the report should mark it for review. That is a feature, not a flaw. It gives you a final checkpoint before sharing anything upward.
Why the talk track matters
Pallavi does not stop at a written report. She also asks for a modular talk track.
This is a subtle but powerful move. In most leadership meetings, the conversation is not linear. People interrupt. Questions pop up early. Tangents happen. If your talking points only work in one rigid sequence, you lose momentum fast.
A modular talk track solves that by making each section strong enough to stand on its own while still connecting back to one central narrative for the quarter.
Her criteria for the talk track are smart:
- Each section should work independently.
- There should be a clear thread tying the quarter together.
- It should be short enough to reset after interruptions.
- It should include risks, dependencies, or assumptions that need support.
- It should clarify what a risk is and what it is not, so the message is not overblown.
That last point matters more than most people realize. Strong leaders do not just raise alarms. They calibrate them. They explain the cause, the likely impact, and the degree of urgency.
That makes your reporting feel controlled rather than reactive.
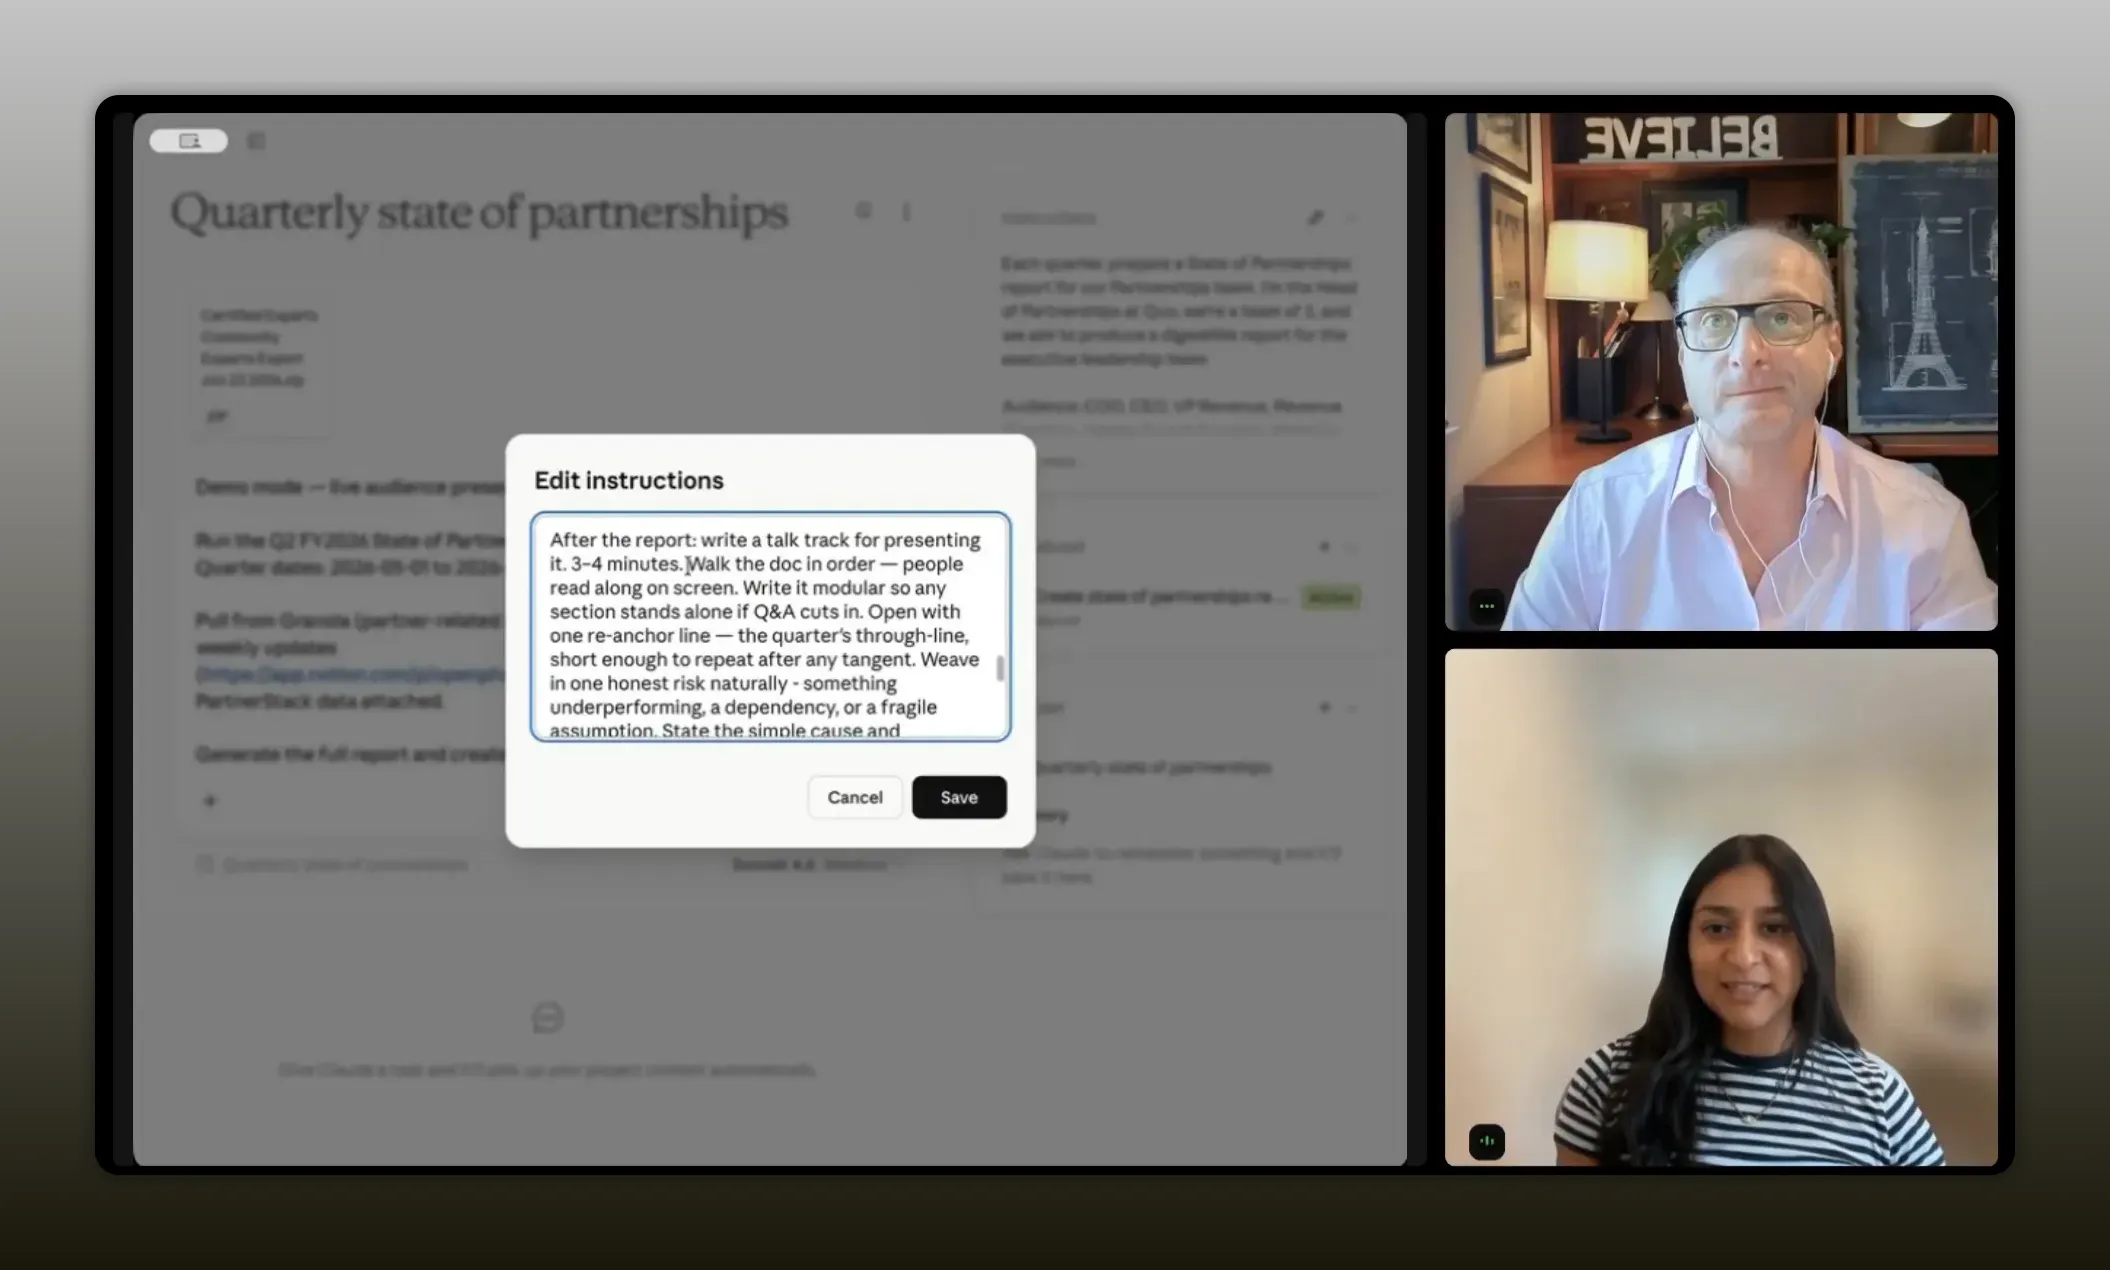
You need a talk track that holds up in real meetings, where questions, interruptions, and tangents happen. A modular story lets every section stand on its own while still tying back to the quarter’s single, revenue-linked narrative. -Pallavi Singh
Where human judgment still matters
None of this works on autopilot.
Pallavi is very clear that AI dramatically reduces reporting time, but it does not remove the need for judgment. A report might go from taking hours to taking around 30 to 45 minutes, but those minutes still matter.
You still need to:
- Check whether the narrative is actually right
- Confirm the numbers are accurate
- Decide whether the suggested throughline reflects reality
- Trim or reframe asks before they go to leadership
- Decide what should be escalated before the formal meeting
This is the right way to think about AI in partnerships. It is not there to replace your understanding of partner behavior, internal politics, or channel nuance. It is there to collapse the distance between messy information and a useful leadership artifact.
That is also why these systems get better with iteration. As you run the process each month or quarter, you start refining the instructions, tightening the asks, and sharpening the reporting style.
If you are interested in the bigger strategic direction of this shift, this look at the state of AI in partnerships adds useful context around how teams are scaling ecosystem work with better systems and data.
Data hygiene and source of truth
There is one question that always shows up in conversations like this, and it should: what if your data is a mess?
Pallavi’s answer is practical. Start with the cleanest source of truth you have.
At Quo, that begins with PartnerStack as a core source for partner data. Additional information lives in systems like Mode and Snowflake, but even when direct AI connections are not perfect, exports still work. Claude can parse uploaded data as long as you can access it.
As long as you can access the data, AI can help parse it. The harder part is making the data clean. -Pallavi Singh
That is the right sequencing:
- Find your cleanest source.
- Export what you need.
- Use AI to structure and summarize it.
- Work with RevOps to improve access and hygiene over time.
Do not wait for perfect data architecture before you improve reporting. But also do not pretend AI can rescue fundamentally unreliable data.
If your partner data is inconsistent, duplicated, or incomplete, your report will still require more manual review. AI speeds synthesis. It does not eliminate the need for trustworthy inputs.
For a broader external perspective on data quality and reporting discipline, the Gartner overview of data quality is a useful reference point, and so is Anthropic’s documentation on Claude if you want to understand the platform itself.
Recommended tools
You do not need an enormous stack to make this work, but you do need a few dependable pieces.
- Claude for generating the report, talk track, and reusable instructions.
- PartnerStack or your partner portal as a source of truth for partner activity and revenue attribution.
- Notion for operating notes, weekly updates, and housing the final report if you prefer documents over slides.
- Mode or Snowflake for structured reporting exports and deeper data pulls.
- Slack as a source of scattered updates that can be folded into the quarterly narrative if needed.
- Speech to text for drafting instructions faster and more naturally.
- Google Slides or PowerPoint if you want to convert the document into a presentation format after generation.
The bigger lesson is not which exact tools you use. It is that your reporting system should sit on top of the workflows you already have, not require a total rebuild before it becomes useful.
FAQs
What is a state of partnerships report?
It is a structured business report that summarizes how your partnerships program performed over a period of time, usually monthly or quarterly. A strong version includes revenue impact, goal pacing, what is working, what is not working, risks, and specific decisions or support needed from leadership.
Why is partnership reporting so hard?
Because partnership teams often report in operational channel terms while executives make decisions in business terms. Metrics like partner count, activation rate, and co-marketing activity matter, but they need to be translated into revenue, risk, retention, and strategic decisions.
Can AI create the whole report automatically?
AI can do a large share of the heavy lifting, especially with synthesis, structure, and drafting. But you still need to review the numbers, verify uncertain figures, and make sure the narrative reflects reality. The best use of AI here is acceleration with oversight, not blind automation.
What data sources should you feed into the report?
Start with the cleanest and most trusted sources you have. That could include your partner portal, CRM exports, BI tools, meeting notes, and internal updates. If your MCP or direct integrations are not reliable enough yet, manual exports are still a perfectly workable starting point.
How often should you run this process?
Quarterly is a strong default for executive reporting, but monthly runs can be useful for internal pacing and blind spot detection. A monthly version helps you catch issues before they become a quarterly surprise.
What makes the prompt effective?
The most effective prompts define the audience, specify the desired structure, block made-up information, demand business implications rather than activity summaries, and ask for a clear throughline that connects the quarter into a coherent story.
Should the final report be a document or a slide deck?
Either can work. Pallavi prefers document-style reporting in Notion, but the same output can be adapted into slides. The better choice depends on how your leadership team prefers to consume information and whether they review material asynchronously before meetings.
Conclusion
The real win in this workflow is not that AI writes a report for you. The real win is that it helps you report partnerships in a way leadership can understand, trust, and act on. When you lead with revenue, identify what needs attention, and frame asks as decisions, you stop sounding like a support function and start sounding like an operator. That shift can change how your program is funded, staffed, and supported. And if you can get there in 45 minutes instead of losing half a day to manual reporting, even better.